Not enough storage is available to process this command

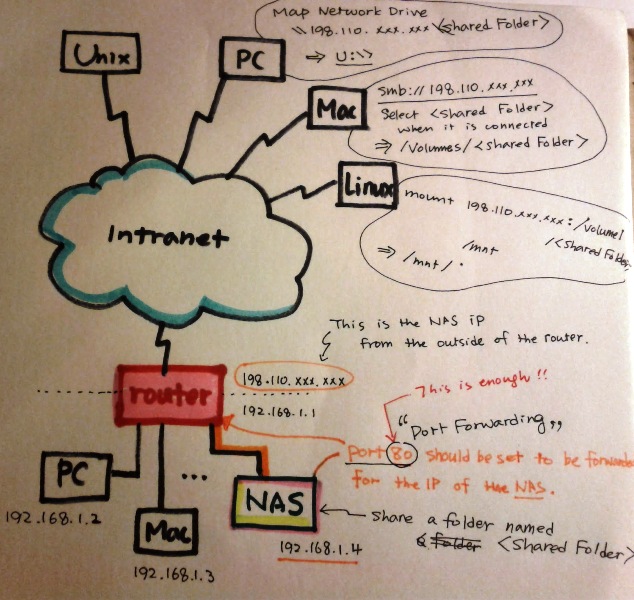
I am going to utilize available PCs in labs of our department to process images. Generating intensity attenuated images takes much time (more than five minutes for one single forty layered image). It would be better to run the processing modules on many machines at the same time. Images on a NAS can be accessible (see more details in my previous posting).

In my first few trials, the new system seemed work. But after that, the network resource where all the executables are located are not accessible any more with a strange error message.

Not enough storage is available to process this command.

I came across a few interesting articles.

At first, it scared me a little bit because the articles say that registries should be backed up and restored. I just tried without backing up the registries to test my luck. 😉

After adding the item in my registry, I restarted my computer and run my image processing sub modules. It seems work for now. I will post if I come across any other problem regarding this issue.

Using NAS to save time in generating intensity attenuated images

It takes much time to compose large images into a single image. In my experiments, I am using forty images to generate an intensity attenuated image. This is even more true when the size of an image is huge like about 12,000 x 9,600. One image has 115,200,000 pixels in this size. Think about forty images when they are processed. It took me eight seconds to compose two images into one with a simulated transparent channel. More than five minutes are needed to generate a single composed image from forty images. I have around 9,628 images. From my rough calculation it will take my machine more than a month to process all the images. This is not a big problem since this process should be done only one time. But I do not like this since I have more tissue samples to process.

My idea is to use multiple computers at the same time in our department’s network. NAS (Network Attached Storage) can be a solution to address this issue. Using the network storage is a good approach because the bottle neck of this system is not reading and writing image data files but processing images. (I realized that reading/writing image files from an NAS take much more time than processing them from my experiments. It will not reduce total consuming time as I initially expect but is worth to use the minimal parallelism.) So it is good to use as many computers as possible to reduce whole processing time.

I purchased a NAS that is Synology DiskStation; DS212j along with two hard disk drives; 2TB and 3TB. This will give me enough space at least for a while.

I have one desktop PC and one Mac Pro under a router in my office. The new NAS is attached to the router. Four high performance PCs in a lab of the ECE department are available for five days in a week. Eight Mac minis in my Mobile App Lab are also usable. I am going to utilize all those computers as much as possible.

Here is a rough system design for it. Tools in KESMSuite should be expanded to be run on this configuration. The port number 80 (this is a default port for HTTP) for the IP address of the NAS should be ‘Port Forwarding’ in the router settings. To my surprise, this port forwarding is enough for this system to work.

Making intensity attenuated images

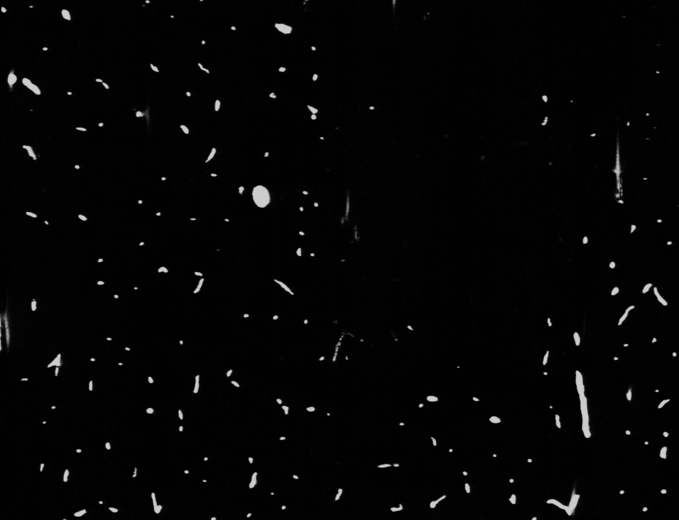
KESM (Knife-Edge Scanning Microscope) can scan really thin (sub-micron level) images from animal tissues. Thin slices are very critical to create accurate volumetric 3D images since the depth structure can be restored more accurately. However, one single image does not make much sense to us when it is shown one by one.

Image

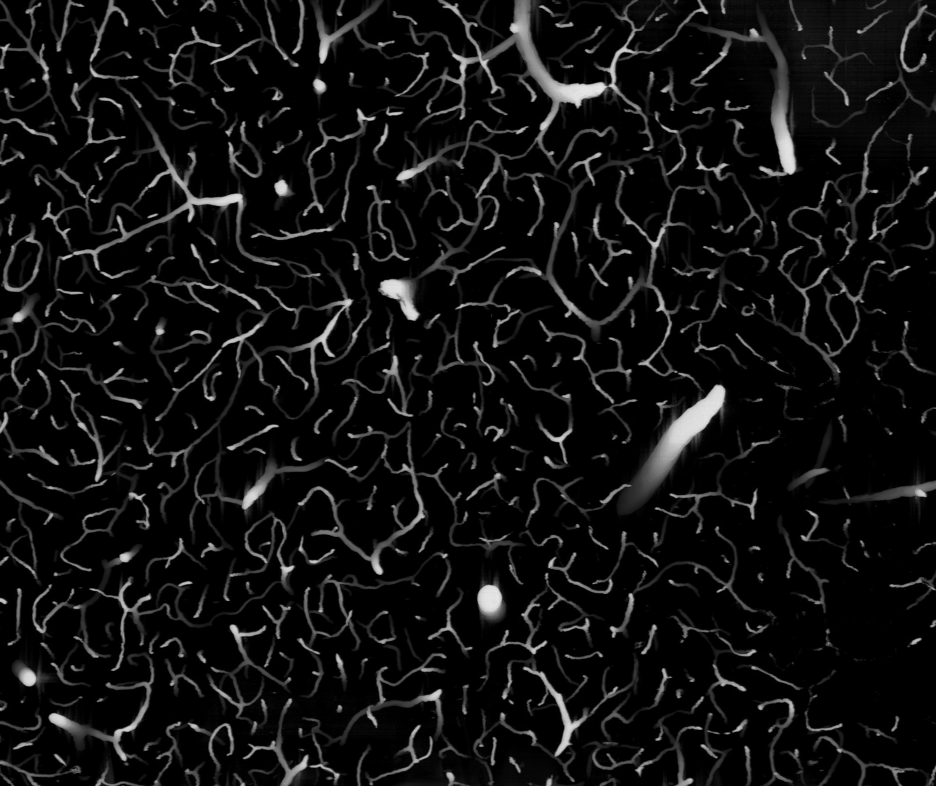
It has bunch of dots and short lines instead of meaningful structure. It would be better to be seen if several images are overlapped with depth attenuation in their intensity levels.

So I implemented a method to create intensity attenuated images. Creating this kind of images is not new because we can use an image editing tool such as Photoshop to create multiple layers in which layer has an alpha channel to set its transparent level. My method does not use the alpha channel and does not need to use a specific image file format that supports the alpha channel. Original JPEG image files can be used without converting them into transparent-support-file-formats. Note that JPEG does not support alpha channel so that you cannot make it transparent with a standard tool.

Here is a sample image. One more good thing is that this image composition can be done automatically using my KESMSuite that is actively being developed. The sample image was generated using 40 consecutive images. To make a realistic pseudo 3D images, the intensity attenuation factor is calculated from a quadratic function of the depth.

Image

Make map tiles with GDAL2Tiles

GDAL and GDAL2Tiles

GDAL (Geospatial Data Abstraction Layer) includes GDAL2Tiles that can generate map tiles for OpenLayers, Google Maps, Google Earth, and similar web maps. GDAL can be installed from OSGeo4W for Windows. We can find OSGeo4W at http://trac.osgeo.org/osgeo4w/. Unfortunately this only works for 32bit Windows as of now I am writing this article.

OSGeo4W is a package from Open Source Geospatial Foundation for Win32 environments. According to the OSGeo website,

OSGeo4W is a binary distribution of a broad set of open source geospatial software for Win32 environments (Windows XP, Vista, etc). OSGeo4W includes GDAL/OGR GRASSMapServer OpenEV uDig QGIS as well as many other packages (about 150 as of fall 2009).

OSGeo4W Setup for 32bit Windows

Caution: Do not follow the instructions at http://trac.osgeo.org/osgeo4w/ or http://help.maptiler.org/betatest/ for GDAL2Tiles. Especially there is a specific instruction at http://help.maptiler.org/betatest/ that you should not follow. That instruction only worked for GDAL 1.6 beta. Here is a new instruction for installation of GDAL for using GDAL2Tiles.

  1. Download the OSGeo4W installer from here.
  2. Run the installer.
  3. Select Advanced install.
  4. Select Libs and select gdal and gdal-python in the Select packages. Caution: do not select any other packages. Some dependent packages will be selected automatically upon your two selections: gdal and gdal-python.
  5. Finish the installation
  6. You can see OSGeo4W icon ion your desktop. That is a batch file invoking the command line prompt.
  7. That’s it.

This only works on Windows 32bit machines. For 64bit Windows machines, we need to follow quite different instructions.

GDAL and GDAL2Tiles Setup for 64bit Windows

OSGeo4W cannot be used for 64bit Windows machines. We have to install GDAL and Python manually.

  1. Install Python from x86-64 Installer at http://www.python.org/getit/.
  2. Run python.exe. We have to find out the compiler version that built the python. In my case, the Python version is 2.7.3 and it was compiled and built with MSC v.1500.Python 2.7.3 (default, Apr 10 2012, 23:24:47) [MSC v.1500 64 bit (AMD64)] on win32
  3. GDAL binary packages for 64bit machines can be found at http://vbkto.dyndns.org/sdk/. Select a corresponding version in the table. In my case, release-1500-x64-gdal-1-9-mapserver-6-0 is the right version in the”MSVC2008 (Win64) -stable” row because the Python was built by 1500.
  4. Download
    1. Generic installer for the GDAL core components – gdal-19-1500-x64-core.msi
    2. Installer for the GDAL python bindings (requires to install the GDAL core) – GDAL-1.9.1.win-amd64-py2.7.msi. I chose this because 1.9.3 is the latest and my Python is 2.7.3.
  5. Install the GDAL core components. There is no option to choose the destination folder for GDAL core. It will be installed into the “C:Program FilesGDAL” folder.
  6. Install the GDAL python bindings.
  7. After the binding, you may move GDAL folder in C:Program Files into wherever you want to.
  8. Add two batch files; gdal.bat and gdal2tiles.bat into GDAL folder. You can find these two bat files below.

gdal.bat

@echo off
rem ---
@echo Setting environment for using the GDAL Utilities.
set GDAL_PATH=<em>&lt;full path of your GDAL installation&gt;</em>
@echo GDAL path is %GDAL_PATH%.
set PATH=%GDAL_PATH%;%PATH%
set GDAL_DATA=%GDAL_PATH%gdal-data
set GDAL_DRIVER_PATH=%GDAL_PATH%gdalplugins
set PROJ_LIB=%GDAL_PATH%projlib
rem ---
@echo Setting environment for using the Python.
set PYTHON_PATH=<em>&lt;full path of your Python installation&gt;</em>
@echo Python path is %PYTHON_PATH%.
set PATH=%PYTHON_PATH%;%PATH%
@echo on @if [%1]==[] (cmd.exe /k) else (cmd /c "%*")

gdal2tiles.bat
python %GDAL_PATH%gdal2tiles.py %*

Now, you are ready to use GDAL2Tiles.

  1. Just double click gdal.bat.
  2. Type gdal2tiles with proper options.

You may combine these two into a single command.

  1. Open a command prompt window.
  2. Type gdal gdal2tiles with proper options.

Good luck and have fun.

Intensity Normalization

Images from the KESM do not have consistent intensity levels. This prevents us to have a clear 3D image by stacking images in a row. Background in an image should have a similar intensity level throughout images.

One is an original 3D image. The other one  is processed 3D  image.

[slideshow]

Computer Engineering Day Camp

Next week, the ECE department hosts Computer Engineering Day Camp for high school students. The program has two different sections: 1) Mobile robot, 2) Smart phone programming. But in the last day, two sections will be integrated into one to control Lego Mindstorm Robots with Smart devices through the Bluetooth technology.

I am responsible for the second section, smart phone programming. To be precise, smart device programming is better term since I am going to introduce some additional tablet devices powered by Android.

App Inventor for Android will be used for programming The block based graphical programming tool, similar to Scratch, was originally from Google Labs. Now it is maintained by MIT.

For more details such as lecture materials, you can visit here.

Moved my web site for courses to WordPress.com

This is a trial to utilize a free blog and an online file sharing site to manage my course web pages. After comparing WordPress with Blogger, I chose WordPress because it provides more features including a better editor. All files were uploaded to Box.com that allows us to have links to share.

I started moving my personal web page from Kettering (http://www.kettering.edu/~jkwon) to WordPress.com. For now, the new web site only has the Teaching section. More sections will come soon.

Wireless Remote Sensor

Sensor data from the ultrasonic sensor can be sent to remote machines. Many choices can be made. Here in this example, in order to send data a Bluetooth module will be used. A Bluetooth module cannot be connected to the Arduino without using an extra parts. The IO Expansion Shield from DFRobot.com is one of options.
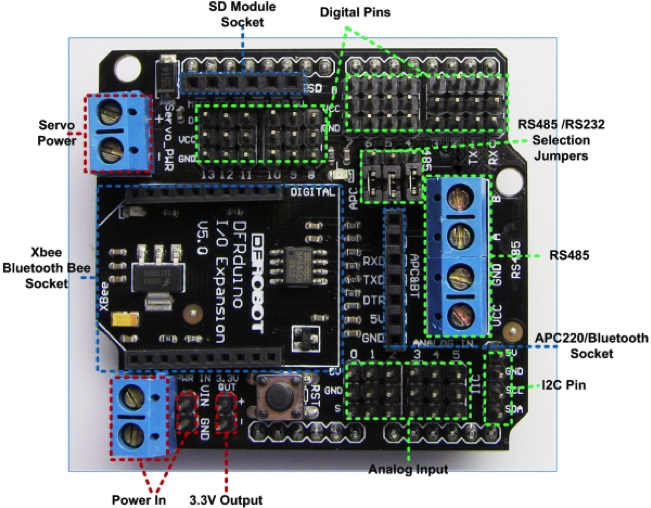
The DF-BluetoothV3 Bluetooth module (SKU:TEL0026) is compatible with the IO Expansion. This combination makes me easier when it comes to adding a Bluetooth module. Using this we can simply add wireless capability into the Arduino. The next step is to attach the ultrasonic sensor to the IO expansion board.

On the expansion board, there are digital and analog pins that are connected to corresponding pins to the Arduino board. Make sure that pins for TRIGGER and ECHO from the ultrasonic sensor are connected to the IO expansion board according to the pin usage in the source code that is used in the previous posting. The picture below shows the assembled module.
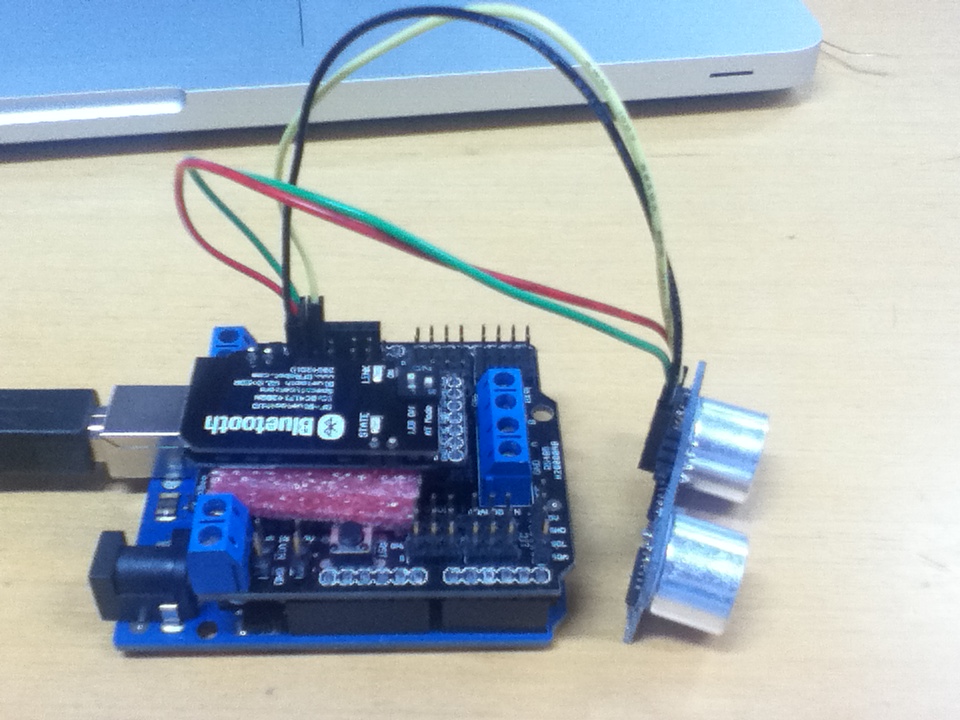
Note that the Bluetooth module should be disconnected when a binary is being uploaded. Anyway, the exact same code from the previous posting can be used so that you do not need to upload a new binary.

The next step is that making pairs between the computer and the Bluetooth module. By doing this, from the computer  communicating with a Bluetooth module is now just simple serial communications.

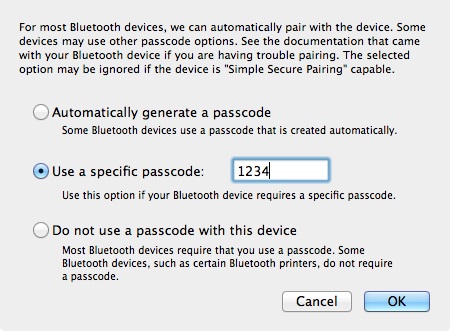
Detail steps depend on the operating system. Followings are from Mac OS X. Choose the Set Up Bluetooth Devices menu item. Select the Bluetooth_V3 item.

The default passcode of the Bluetooth module is ‘1234.’ When you are prompted use the passcode.
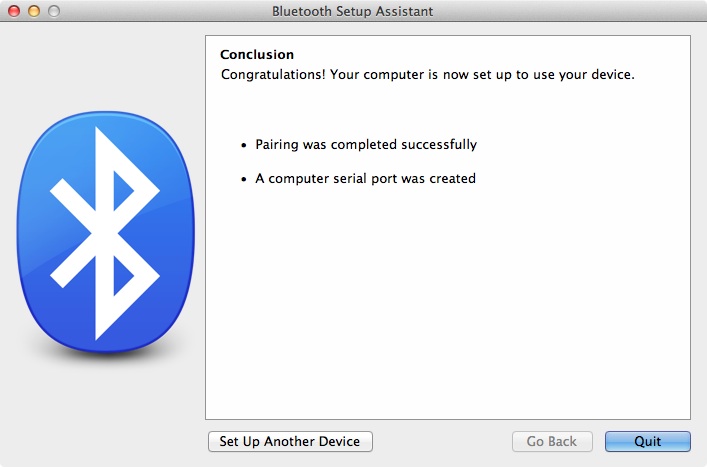
When the pairing is completed successfully the window below will be shown.
Practically we are done. Open any terminal software for serial communication. I recommend CoolTerm that can be downloaded from here.

One extra optional step is visualizing the sensor data. Processing (processing.org) is used to visualize sensor data from the Bluetooth module. I made the visualization code as simple as possible.

 
import processing.serial.*;
// screen width
int maxWidth = 800;
int maxHeight = 100;
int lf = 10;

// The serial port
Serial myPort;
float gCurDist;
Graph gGraph;

void setup() {
  // List all the available serial ports
  println(Serial.list());

  // Open the port you are using at the rate you want:
  // You may change the index number accordingly.
  myPort = new Serial(this, Serial.list()[0], 9600);
  myPort.bufferUntil(lf);

  // myPort = new Serial(this, "/dev/tty.Bluetooth_V3-DevB", 9600);
  size(maxWidth, maxHeight);
  smooth();

  gGraph = new Graph(700, 80, 10, 10);
}
void serialEvent(Serial p)
{
  String incomingString = p.readString();
  println(incomingString);
  String[] incomingValues = split(incomingString, ',');

  if(incomingValues.length &gt; 2) {
    float value = Float.parseFloat(incomingValues[1].trim());
    gCurDist = value;
    //println(gCurDist);
  }
}
void draw() {
  background(224);
  gGraph.distance = gCurDist;
  gGraph.render();
}
class Graph {
  int sizeX, sizeY, posX, posY;
  int minDist = 0;
  int maxDist = 500;
  float distance;

  Graph(int _sizeX, int _sizeY, int _posX, int _posY) {
    sizeX = _sizeX;
    sizeY = _sizeY;
    posX = _posX;
    posY = _posY;
  }

  void render() {
    noStroke();
    int stemSize = 30;

    float dispDist = round(distance);
    if(distance &gt; maxDist)
      dispDist = maxDist+1;
    if((int)distance &lt; minDist)
      dispDist = minDist;

    fill(255,0,0);
    float distSize = (1 - ((dispDist - minDist)/(maxDist-minDist)));
    rect(posX, posY, sizeX-(sizeX*distSize), sizeY);
  }
}

Ultrasonic Sensor

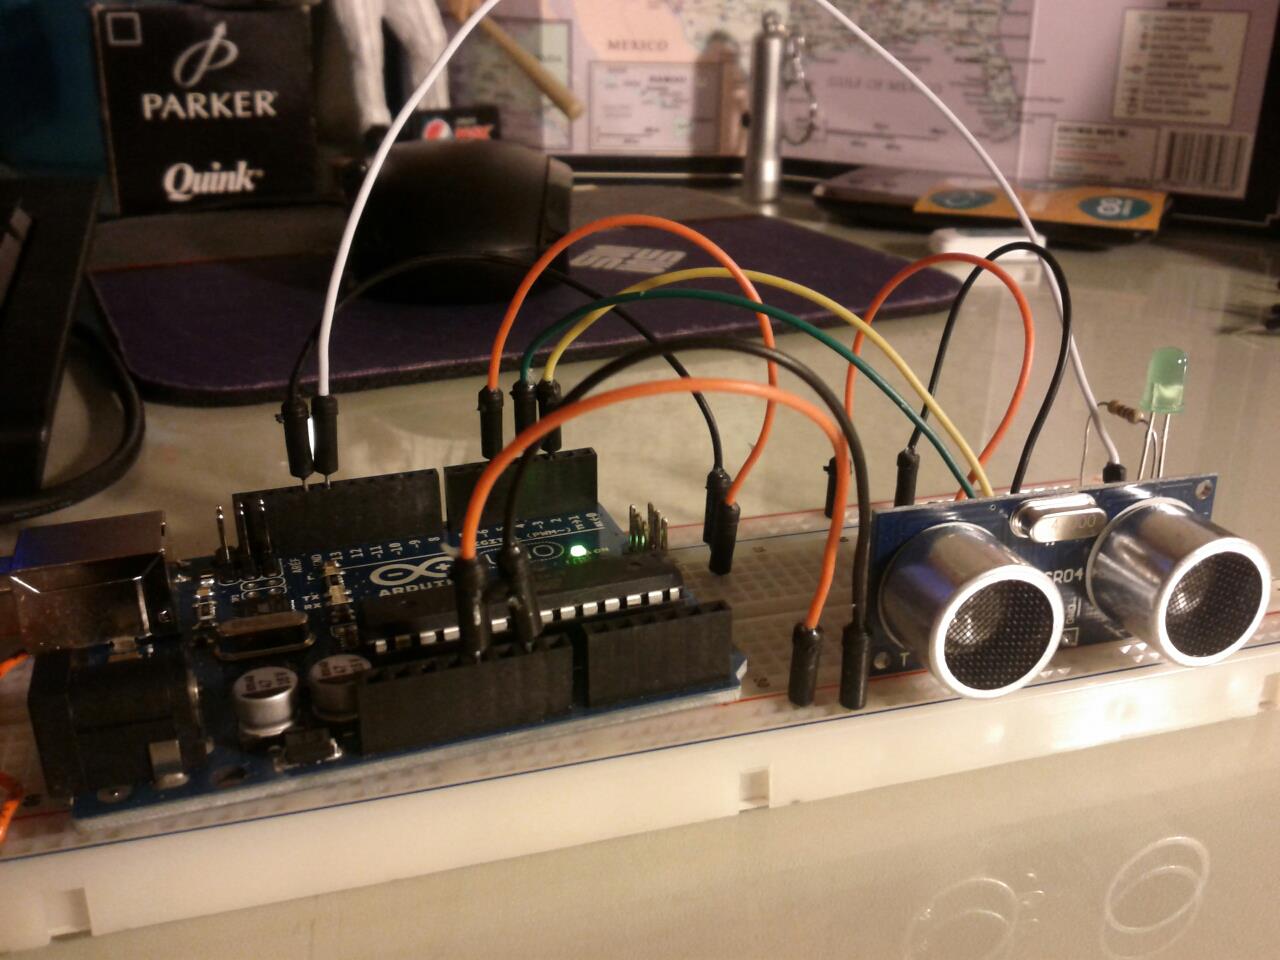
Ultrasonic sensor test. It works. Nice.

Ultrasonic sensor module is HC-SR04. I purchased this from virtuabotix.com. The company provides a Ultrasonic library.

  • Go to https://www.virtuabotix.com/feed/?page_id=1587 and find the Ultrasonic section.
  • Download the library.
  • Unzip it and copy the unzipped folder to your Arduino libraries folder.
  • You may restart Arduino to let it recognize the new library.
  • Use an example code for your starting step.

Here is the example.

#include &lt;Ultrasonic.h&gt;
#define TRIGGER_PIN 12
#define ECHO_PIN 13
Ultrasonic ultrasonic(TRIGGER_PIN, ECHO_PIN);
void setup()
{
  Serial.begin(9600);
}
void loop()
{
  float cmMsec, inMsec;
  long microsec = ultrasonic.timing();
  cmMsec = ultrasonic.convert(microsec, Ultrasonic::CM);
  inMsec = ultrasonic.convert(microsec, Ultrasonic::IN);
  //Serial.print("MS: ");
  Serial.print(microsec);
  Serial.print(", ");
  //Serial.print(", CM: ");
  Serial.print(cmMsec);
  Serial.print(", ");
  //Serial.print(", IN: ");
  Serial.println(inMsec);
  delay(1000);
}

Just wire pins as the source code says. Then open the Serial Monitor from Arduino. You will see he raw milliseconds and distance in centimeter and inch.

That’s it.